This study was undertaken to develop ITU-R P.452 for use in point-area modelling above 3 GHz has been described in other requirements for this Label. This work included a fairly extensive measurement campaign also involving the Rutherford Appleton Laboratory and Durham University.
The purpose of the measurement campaign was twofold; to give a basis for model development and provide empirical evidence for the deterministic aspects of the eventual model, and to provide an initial set of data against which the model may be validated. As noted above, the model is to be based on the existing ITU-R point-to-point model, given in Recommendation P.452.The most important additions to this model are the treatment of clutter loss at the terminals, and the treatment of location variability.
As a consequence, much of the measurement effort was focussed on examining the impact of the environment local to a terminal on the overall path loss. Two types of measurement were made, generally at the same time; in the first, a transportable receive terminal with a pump-up mast was used to sample field strength, at heights between 2.5 m and 7 m above ground level, at individual locations; the second set of measurements were made using a mobile receiver, logging field strength continuously at a height of 1.5 m above ground.
To allow flexibility in the choice of paths and environments investigated, a transportable transmit terminal was used, with a mast height variable up to 16 m and an EIRP of 200 W. Three frequencies were used for the measurements; 2.4 GHz, 3.4 GHz and 5.7 GHz. The lower frequency was chosen as a ‘benchmark’ to allow comparisons to be made with existing models intended for use below 3 GHz.
The transmission equipment was accommodated in a Land Rover with a 16 m pump-up mast, shown below. The antennas were mounted one above each other with the 5.7 GHz unit at the top and the 2.4 GHz at the bottom.
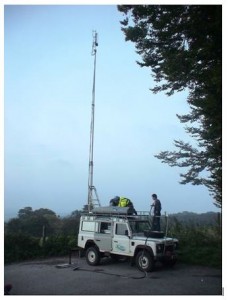
A second Land Rover with a 7 metre pump-up mast acted as the fixed receiver terminal and measurements were made at four aerial heights between 2.6 and 7.2m above ground.
In addition mobile receive equipment was contained in a small car and each sample measurement was stamped with the time and location from a GPS receiver.
The measured data was compared with the model data. The figure below shows a sample comparison between the measurement data (raw=grey, averaged=red) and an intermediate form of the model (blue).
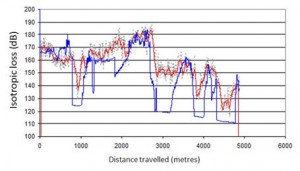 In this instance the model was predicting (near) line of sight paths where none existed.